How to use Turtle Diagrams

What is a Turtle Diagram?
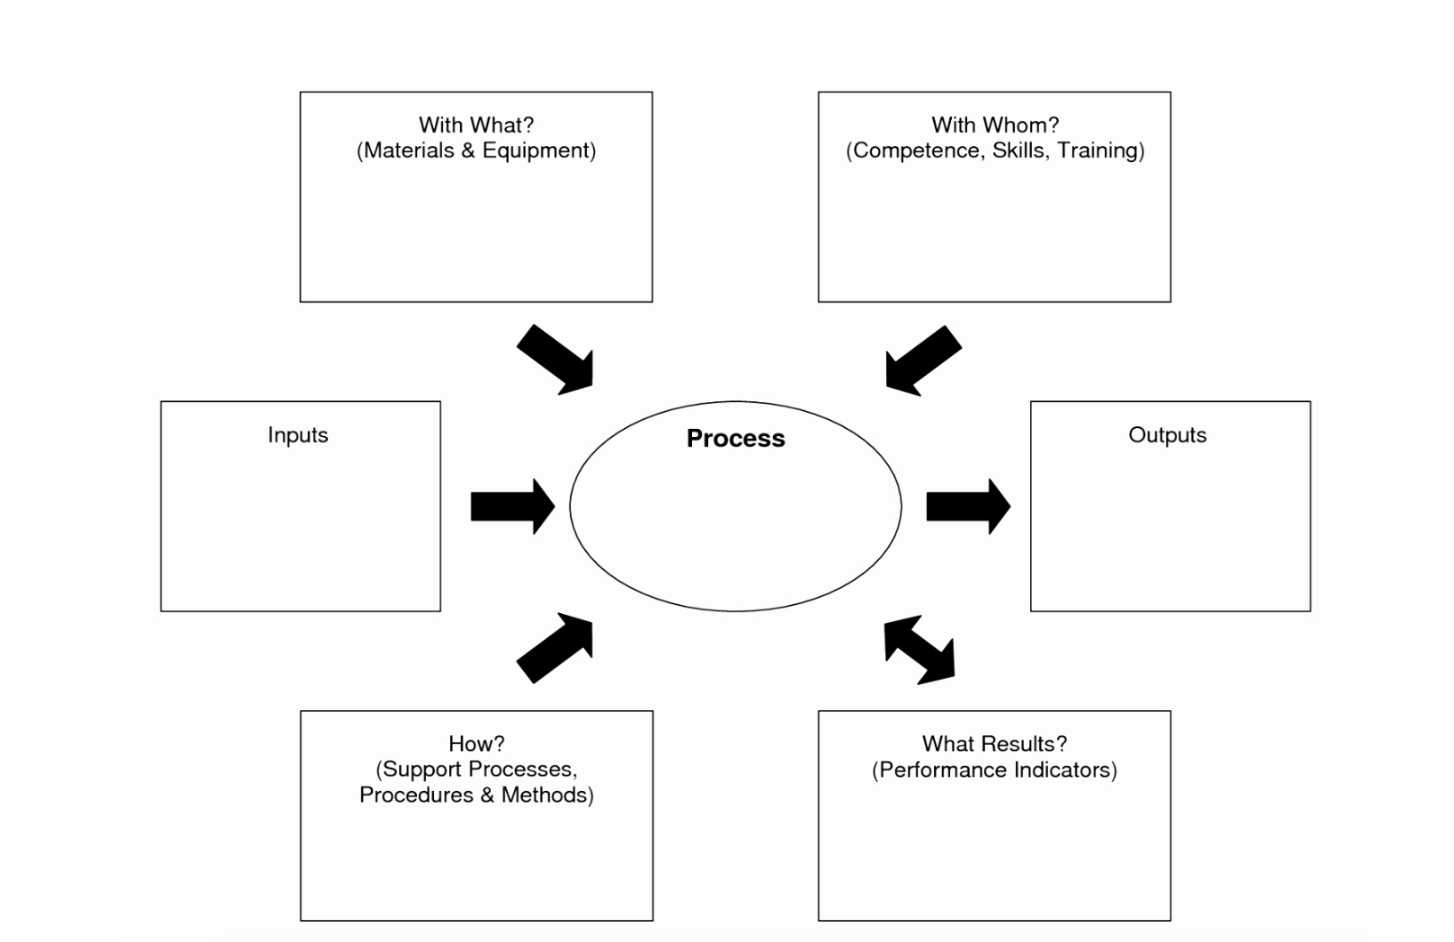
“Turtle Diagram” is a great tool for visualizing process characteristics. Processes are made up of inputs, outputs, criteria, etc, and a Turtle Diagram visualizes a process to assist in their effective execution and improvement. The diagram looks like the body of a turtle, with components as body, legs, head, and tail.
Benefits of Using Turtle Diagrams
Turtle Diagrams allow you to look at the entire process, as well as the communication and mapping of interrelated processes with relevant functions and levels within the organization. Turtle Diagrams can help both management and the workforce better understand the process. The diagram helps layout the framework in an easy to follow fashion, and can identify gaps in the organization’s structure.
Is there an ISO requirement to develop Turtle Diagrams?
There are no requirements for organizations to develop Turtle Diagrams. In the requirements of ISO 9001, Clause 4.1 states, “The organization shall identify the processes needed for the QMS and their application throughout the organization and determine the sequence and interaction of these processes.”
There may not be a requirement specifically for the turtle diagram, but the turtle diagram may in fact help each organization meet the requirements for organizations to determine and manage numerous linked activities to enable the transformation of inputs and outputs.
Turtle Diagrams can help both management and the workforce better understand the process. The diagram helps layout the framework in an easy to follow fashion, and can identify gaps in the organization’s structure. When the diagram is laid out, the organization can further develop measures for better efficiency.

Click Here to Download a Turtle Diagram Word Document
So how do you use a Turtle Diagram?
Using a turtle diagram is simple. The Turtle Diagram is made up of 6 areas, all surrounding the process, which is considered the turtle body. The 6 areas are: inputs, materials & equipment (what), support processes, procedures & methods (how), outputs, competence skills & training (whom), and finally performance indicators (results).
Process: The center of the diagram is titled “process”. This box addresses the value adding step, and any sequence that falls within the scope of the process. A process may involve many employees and multiple departments within your organization.
Inputs: This category should define the details of the actual process including: documents, materials, information, requirements, etc.
Outputs: This should include details of the process such as products, documents, etc.
Support Processes, Procedures & Methods: Support materials include procedures, instructions, specific methods, etc.
Whom: This section is dedicated to finding all the employees whose roles within the organization have the responsibility to value adding steps within the process.
What: This section is dedicated to finding the resources needed to perform the process.
How: This section is dedicated to identifying any specific documents within the management system that tell the people responsible for completing the value added steps how to successfully complete them within the organization’s best practice.
Results: This section looks at the measures the organization has at its disposal to monitor how well the procurement process is performing. If the measures align to the organization’s plan, policies, goals, and objectives, then the measures should be able to tell management if the procurement process is fulfilling or needs to be adjusted or improved.
Auditing: The turtle diagram is also beneficial when it comes to auditing. The diagram allows you to understand the input/output processes and activities under the scope of the internal audit. The diagram can help give an auditor a guide to perform a process audit and helps identify the direction of the audit it will follow.


